


Markets have habits. They don’t have appointments. Here’s how I use seasonal, presidential and Fed cycles without turning them into superstition.
Every fall, investors rediscover that September is supposedly terrible. Every spring, “sell in May” gets dusted off and marched back onto financial television. Then the market does something completely different (because of course it does), and everyone acts surprised.
That doesn’t mean seasonality is useless. It means we keep asking it to do a job it was never designed to do.
One of the people who figured this out early was Larry Williams. Back in the 1970s, Williams started statistically testing seasonal tendencies in commodities and building actual seasonal indexes instead of just repeating market folklore. He also developed his four-year “master stock market pattern,” an early attempt to map the recurring turns in the political cycle.
The important word here is tendency (not destiny).
Williams has repeatedly described a seasonal pattern as suggestive, not mandatory. His practical test is pretty simple: compare what the market’s doing now with the seasonal model. If price isn’t behaving in a way that lines up with the pattern, don’t force the trade. The market doesn’t owe the calendar anything.
That’s the right way to think about every cycle in this article:
- A seasonal pattern can give you a bias.
- Price action can give you confirmation.
- Risk management decides whether the idea survives contact with reality.
The calendar can be a tailwind or a headwind. It’s not the steering wheel.
What seasonality actually measures
Seasonality asks one fairly narrow question: has an asset tended to behave differently at certain times of the year?
Those tendencies can exist for perfectly ordinary reasons:
- Pension and retirement contributions create recurring flows.
- Tax deadlines and tax-loss selling affect positioning.
- Companies report earnings on a quarterly rhythm.
- Funds rebalance at month-, quarter- and year-end.
- Commodities follow planting, harvest, weather and inventory cycles.
- Consumer spending changes around holidays and vacations.
- Elections and fiscal deadlines change the timing of policy decisions.
None of this is mystical. People and institutions use calendars, so markets inherit some calendar effects. That’s it—no moon phases required.
There’s a catch, though: an average is a mash-up of many very different years. It includes wars, recessions, bubbles, rate shocks, calm bull markets and a few episodes nobody saw coming. That nice, smooth seasonal line never actually happened in any single year (averages are sneaky like that).
The average year has a shape
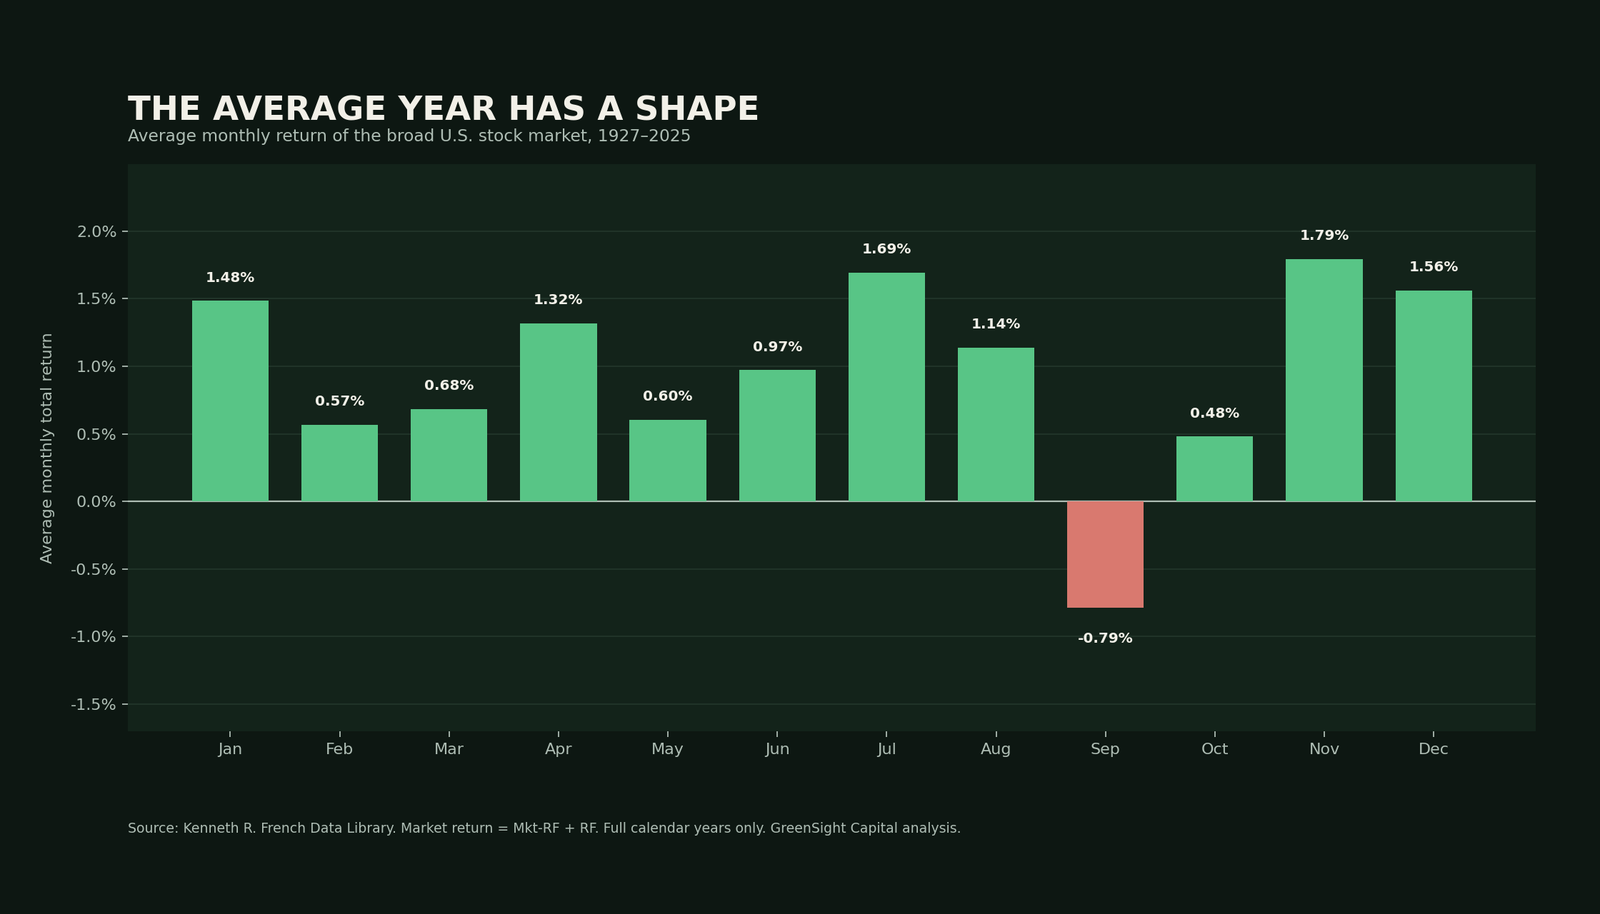
Using broad U.S. stock-market returns from the Fama–French data library, the pattern from 1927 through 2025 is pretty easy to spot:
- September stands out. It’s the only month with a negative average return in this sample, at roughly -0.8% (September, please see me after class).
- November, July and December have been strongest on average.
- January and April have also been solid, although the famous January effect has changed as markets and tax behavior have changed.
- May is positive on average. “Sell in May” is really shorthand for a historically weaker six-month stretch—not proof that May itself has to fall out of bed.
This chart is useful. It’s also dangerous if you read it too literally.
September’s average doesn’t mean every September will be negative. It means I’d probably want a little more confirmation before chasing an extended market into a historically awkward part of the calendar. Likewise, a strong November tendency won’t rescue a market with collapsing earnings, widening credit spreads and a broken price trend. November isn’t a superhero.
Here’s my preferred pecking order:
- Regime: Is growth accelerating or deteriorating? Is inflation rising or falling? Is liquidity expanding or contracting?
- Trend: Is price above or below its major moving averages? Are highs and lows moving in the same direction?
- Participation: Is the move broad, or is a small group of stocks doing all the work?
- Seasonality: Does the calendar support what the first three are already suggesting?
- Risk: Where is the idea wrong, and how much am I willing to lose if it is?
Seasonality belongs in the fourth slot, not the first. Starting with the calendar and working backward is how a useful clue turns into a superstition.
Larry Williams’ best lesson: demand confirmation
Williams is associated with seasonal trading because he did the unglamorous work of turning repeating behavior into data. But he’s never argued that a seasonal chart should be traded blindly (that would be much easier, but markets rarely hand out easy).
In interviews, he has stressed two practical ideas that retail investors can borrow:
- Treat the pattern as a roadmap, not a command. It tells you where turns have often occurred, not where they have to occur this year.
- Look for congruence. If the seasonal model points higher but the market can’t rally on good news, that failure is information (and probably more useful information than the seasonal pattern itself).
For futures traders, Williams has often used commercial positioning in the Commitments of Traders report as one confirming input. Stock investors can use more familiar checks:
- Is the index making higher highs and higher lows?
- Are more stocks above their 50- and 200-day moving averages?
- Are earnings estimates rising or falling?
- Are credit spreads calm or widening?
- Are economically sensitive sectors confirming the move?
- Is volatility falling during rallies and rising during declines?
You don’t need all six lights to turn green. You do need more than “it’s usually a good month.”
The presidential cycle: policy has a calendar too
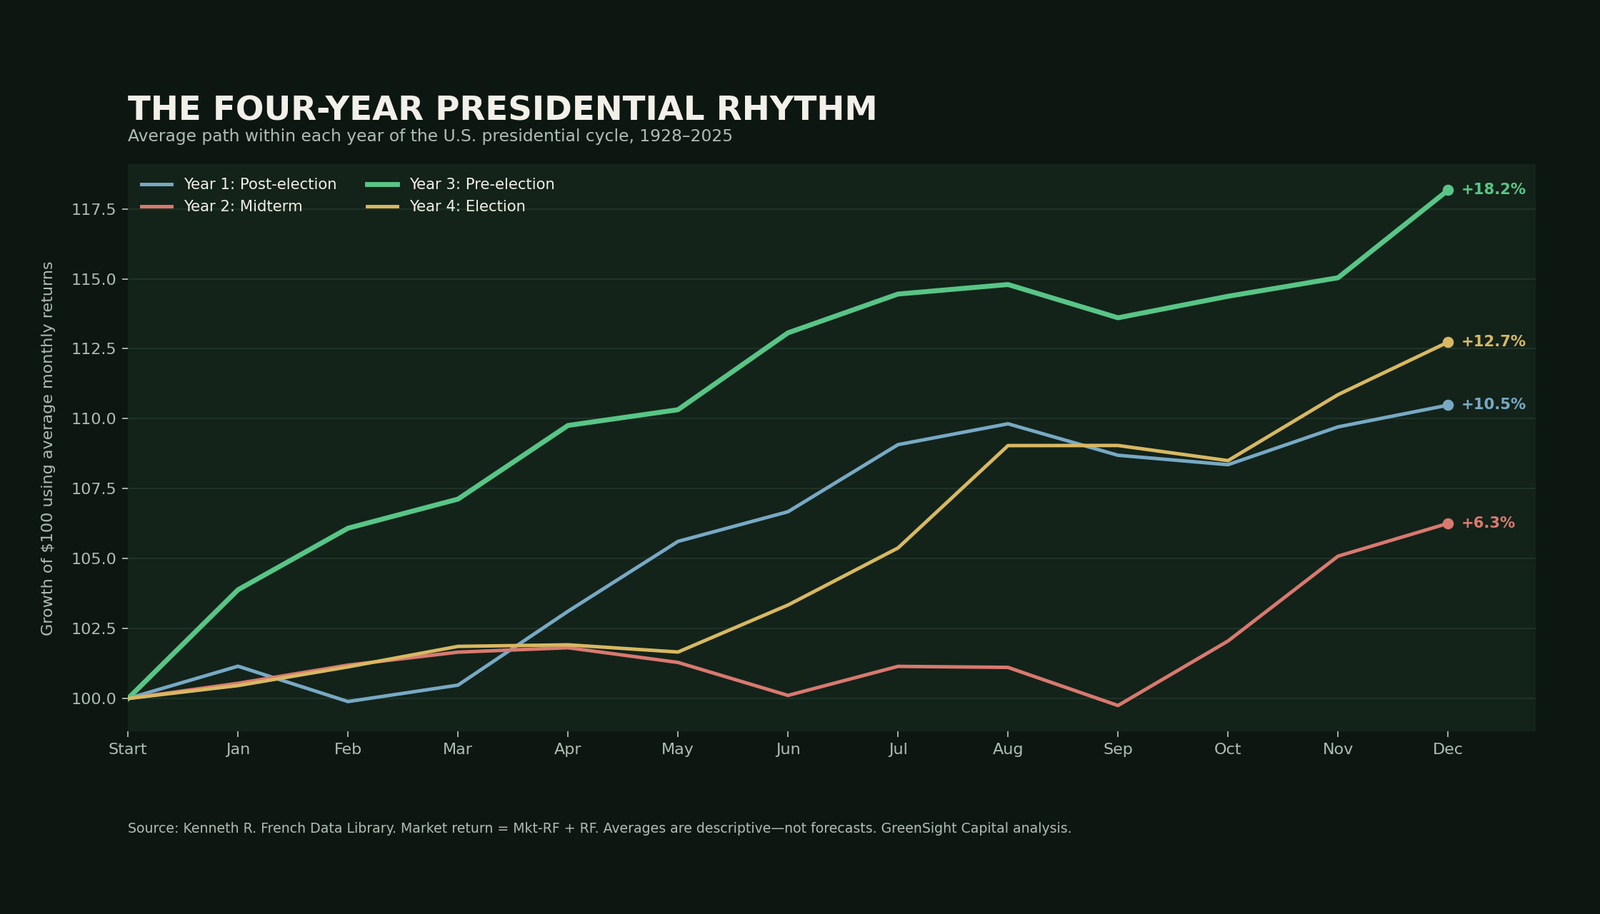
Williams’ four-year stock-market pattern is one of his better-known contributions. The idea isn’t that the market cares which party has better yard signs (or louder cable-news guests). The more plausible mechanism is the timing of policy.
The rough rhythm looks like this:
- Year 1 — post-election: A new or returning administration has room to absorb some political pain, reset priorities and push less popular policies.
- Year 2 — midterm: Policy uncertainty tends to build, and markets often struggle before the midterm election resolves part of it.
- Year 3 — pre-election: Historically the strongest year. Fiscal support, regulatory caution and the entirely shocking desire for a healthy economy before an election can all help.
- Year 4 — election: Returns have still been positive on average, but headlines, positioning and uncertainty can make the path noisier.
In the broad U.S. market data used here, the average paths compounded to approximately:
- +10.5% in post-election years
- +6.3% in midterm years
- +18.2% in pre-election years
- +12.7% in election years
That’s a meaningful historical gap. It’s not a law of nature.
The sample is also fairly small—only about two dozen complete presidential cycles. The rules of campaigning, fiscal policy and central banking change over time, too. A pandemic, banking crisis or inflation shock isn’t going to check the election calendar before barging through the door.
The actionable version is pretty modest: in a pre-election year, remember that the historical backdrop has been favorable and don’t turn bearish just because the headlines are loud. In a midterm year, leave more room for volatility and watch for improvement after the uncertainty peaks. In every year, let current data overrule the template. The template doesn’t get a vote.
The Fed cycle: the first hike is not the crash button
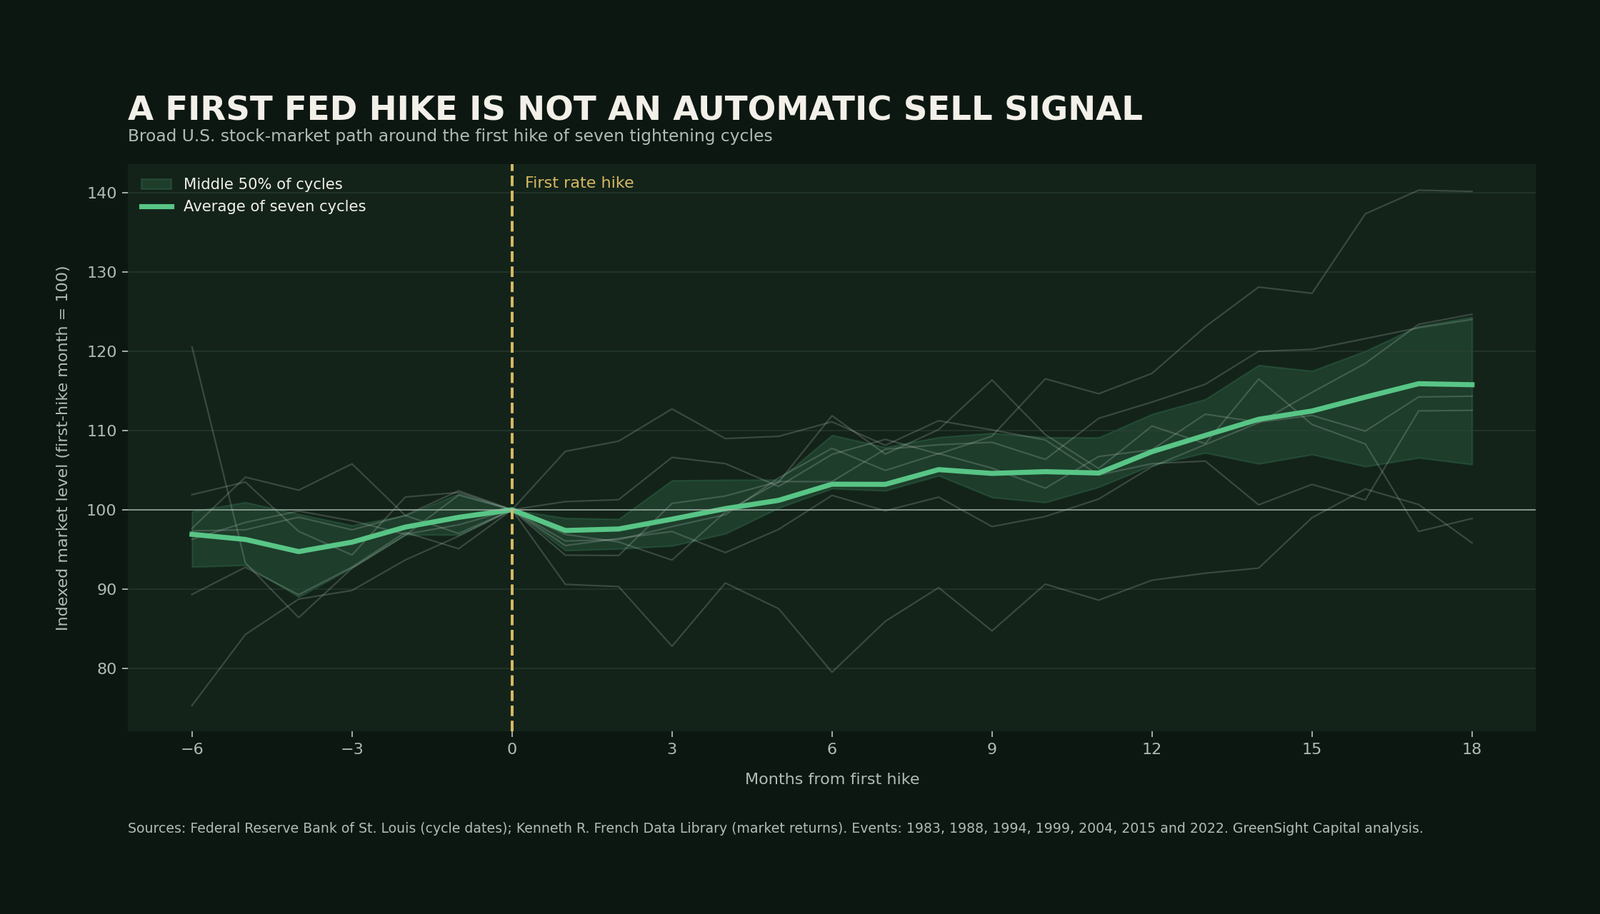
Rate hikes are another area where investors love turning a cycle into a slogan. “Don’t fight the Fed” is useful. It’s not the same thing as “hit the giant red SELL button after the first hike.”
The chart above shows the broad U.S. stock market around the first increase in seven Fed tightening episodes beginning in 1983, 1988, 1994, 1999, 2004, 2015 and 2022. The thick line is the average; the faint lines are the individual cycles (a.k.a. the part that keeps us humble).
Two things jump out:
- The average market was higher 18 months after the first hike.
- The individual outcomes were all over the place.
That spread matters more than the average. A first hike often arrives because growth is decent, hiring is firm and the Fed thinks the economy can handle tighter policy. Trouble usually comes later, if rates stay restrictive long enough to damage credit, housing, investment and earnings.
The St. Louis Fed identified the 1983–84 and 1994–95 episodes as soft landings among the six pre-2022 cycles it reviewed. Four others were eventually followed by recessions, with an average of roughly 15 months between the final hike and the business-cycle peak. “Eventually” is doing a heroic amount of work in that sentence. It’s not a trade entry.
Instead of reacting to one rate decision, watch the sequence:
- Why is the Fed hiking? Strong real growth is different from an inflation emergency.
- How fast is policy tightening? A slow normalization is different from repeated large hikes.
- What is the yield curve doing? Inversion is a warning; re-steepening because short rates are falling can mean stress has arrived.
- Is credit cracking? Watch lending standards, high-yield spreads and bank funding pressure.
- Are earnings holding up? Markets can tolerate higher rates better when profits are still rising.
- Has liquidity turned? Rate levels matter, but so do the balance sheet, fiscal flows and dollar conditions.
The Fed cycle is a process, not a date on a chart (sadly, calendars don’t ring a bell at the top).
Other cycles worth keeping on the radar
Seasonality is much bigger than “sell in May.” A useful market calendar should include a few other repeating forces, too.
Turn of the month
Stocks have often been stronger around the final trading day of one month and the first few days of the next. Regular savings contributions, payroll flows and institutional rebalancing are plausible drivers.
Use it for: timing entries you already want to make. Don’t buy a broken chart just because payday is near.
Quarter-end and year-end rebalancing
Large funds periodically sell what outperformed and buy what lagged to restore target weights. The effect is more noticeable after a quarter with a large gap between stocks and bonds or between market sectors.
Use it for: anticipating temporary flow pressure, especially in the final sessions of March, June, September and December.
Tax-loss selling and the January bounce
Investors often sell losers late in the year to realize tax losses. The most beaten-down names can then rebound when that pressure disappears.
Use it for: building a watchlist of liquid, fundamentally survivable laggards—not catching every falling knife that happens to have a ticker symbol.
Earnings season
Earnings arrive in waves, and the market’s reaction can reveal more than the number itself. If stocks rise on mediocre reports, expectations may already be washed out. If they fall on beats, positioning may be crowded.
Use it for: judging the market’s mood and identifying whether good or bad news is already priced in.
Options expiration and index rebalancing
Monthly and quarterly expirations can concentrate hedging flows. Index additions, deletions and rebalances can create forced buying or selling.
Use it for: explaining short bursts of price action that may have very little to do with fundamentals. There’s no need to invent a conspiracy when a calendar will do.
Commodity and weather cycles
This was central to Williams’ early seasonal work. Crops, energy demand and inventories have physical calendars. Weather can bend the pattern, but it doesn’t erase the underlying production cycle (corn remains stubbornly uninterested in FOMC Twitter).
Use it for: context if you trade commodity producers or futures. Inventory, positioning and trend still need to confirm the setup.
The longer liquidity and credit cycle
This cycle doesn’t fit neatly into a calendar year, but it can steamroll the smaller patterns. Easy money encourages leverage and risk-taking; tighter money exposes weak balance sheets; losses lead to caution; eventually the system resets.
Use it for: deciding how much weight to give every other seasonal signal. A favorable month is still a pretty weak tailwind inside a credit storm.
A simple seasonal checklist for retail investors
Before acting on any calendar pattern, I’d run through this list:
- Write down the tendency. What usually happens, during exactly which dates, and in what asset?
- Check the sample. Is the claim based on 80 years of monthly data or six cherry-picked examples?
- Ask why it might exist. Flows, taxes, policy and production cycles are better explanations than numerology (usually a good rule in life, too).
- Check the current regime. Inflation, growth, liquidity and valuation can overwhelm the calendar.
- Demand price confirmation. Trend, breadth and relative strength should agree with the setup.
- Define the invalidation point. Decide what would prove the trade wrong before you enter.
- Size it normally. A pretty historical average doesn’t justify extra leverage.
- Track the result. Keep a small journal. Patterns that no longer work should lose influence.
Here’s the compact version:
Pattern + confirmation + risk control. Remove any one of the three and you’re mostly trading a story.
The bottom line
Larry Williams helped move market seasonality from folklore toward something measurable. His work matters not because the market repeats perfectly, but because human behavior, institutional flows and policy schedules do repeat imperfectly.
That distinction is where the edge lives (or at least where it rents an apartment).
Use seasonal and political cycles to prepare, not predict. Use the Fed cycle to frame risk, not to schedule the next crash down to the minute. Let price confirm the thesis. And keep the position small enough that a broken pattern is an inconvenience—not a financial event.
Markets rhyme with the calendar. They don’t sign contracts with it.
Sources and methodology
- Larry Williams, Innovations — seasonal indexes and the four-year master stock-market pattern.
- MoneyShow interviews with Williams on seasonal tendencies and using confirmation.
- Kenneth R. French, Data Library. Charts use the value-weighted U.S. market return (Mkt-RF plus the one-month Treasury-bill rate). Calendar analysis uses full years from 1927–2025; presidential-cycle analysis begins in 1928.
- Federal Reserve Bank of St. Louis, Fed tightening episodes since the 1980s. First-hike dates are taken from the St. Louis Fed’s episode table, with March 2022 added as the next cycle.
Disclosure: This article is for education and general information only. It is not individualized investment advice. Historical averages do not predict future returns, and all investing involves risk, including loss of principal.